Ethereum / U.S. Dollar (ETHUSD)
- Feb 10
- 9 min read
Manhattan Crypto Capital Quant Research

Ethereum / U.S. Dollar (ETHUSD)
3 min read
Asset Type: Crypto (Layer-1 Smart Contract Platform)
Sector: Digital Assets
Industry: Decentralized Computing / Smart Contracts
Chart Timeframe: 1M (Monthly)
Current Price (Chart): ~2,012.60
Vehicle Role: High-Beta Growth / Tactical Satellite
Fund Mandate: Asymmetric Leverage / Growth Engine
Issue: December 19, 2025
1. Asset Overview
Ethereum is the leading programmable smart contract platform, anchoring DeFi, NFTs, and broader Web3 infrastructure. ETH functions as both a utility (gas) and a monetary asset inside its own ecosystem.
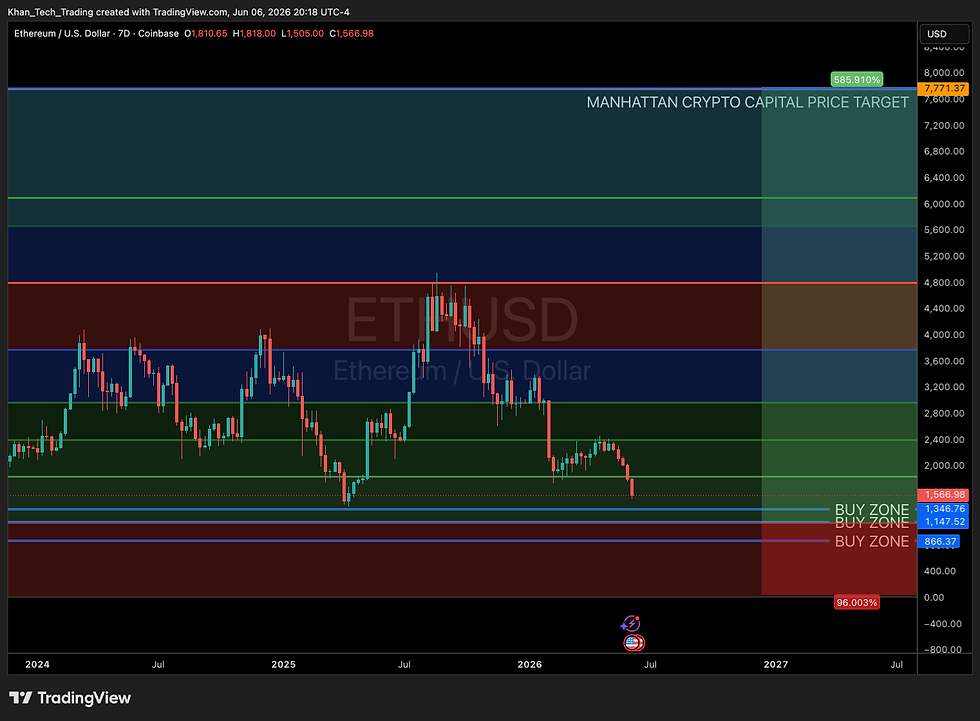
The chart shows a completed post-mania blow-off (2021), a deep cyclical bear, and a subsequent recovery leg that is now correcting back into a long-term rising demand channel.
Price is currently retesting a multi-year ascending trendline from the 2020 lows, with clearly defined horizontal support layers between ~2,000 and ~700.
Inside the Manhattan Crypto Capital framework, ETH is a core crypto growth engine but not a reserve asset; it sits behind private credit and BTC in the capital stack and is used for asymmetric cycle-driven allocations rather than permanent capital.
2. Market Regime & Quant Score
Market Regime: Correction / Trendline Retest
Total Quant Regime Score: 52 / 100
Fear / Greed Quant State:
State: Fear → Controlled Fear
Justification: Multi-month sequence of lower highs and lower lows from the 4,955.90 region; persistent selling pressure but with price now testing a long-term rising support line and entering a multi-layer demand cluster.
Interpretation:
The euphoric expansion regime has fully unwound. ETH is in a structural correction, but not a secular breakdown. Long-term trend support is still intact so long as the 1,286–700 band ultimately holds. A confirmed monthly close back above ~3,000 would start to re-establish an expansion regime; a decisive breakdown through ~700 would mark a cycle reset.
3. Manhattan Crypto Capital Portfolio Context
Role inside engines:
Crypto Growth Engine: High-beta core position alongside BTC, sized smaller than BTC due to higher volatility.
Hedge/Option on Web3 adoption: Captures upside from DeFi/NFT/infrastructure cycles.
Volatility behavior:
Historically extreme; 60–90% peak-to-trough drawdowns within cycles are normal.
Monthly swings of 20–40% are common at inflection points.
Cross-asset interaction:
Correlated with BTC but with higher beta; tends to underperform BTC in panics and outperform in late-stage risk-on.
Negatively sensitive to sharp rises in real yields and liquidity withdrawal.
Competes with speculative tech/equities for marginal risk-on capital.
Capital rotation logic:
Private credit / yield → BTC core → ETH satellite when cycle turns risk-on.
On exits, capital recycles back into private credit, BTC, or defensive equities/gold depending on macro regime.
4. Fundamental Analysis (Approximated – Crypto Adaptation)
Business Quality (Score: 72 / 100)
Dominant Layer-1 smart contract platform with deep network effects (developers, tooling, liquidity).
Transitioned to Proof-of-Stake, aligning security with capital rather than pure energy.
Competes with newer L1s and L2 rollups but retains the deepest liquidity and protocol stack.
Financial Strength (Score: 68 / 100)
No traditional balance sheet; “financial strength” proxies via validator set size, stake distribution, and fee revenue.
Net ETH supply can be deflationary during high fee periods, effectively shrinking float.
Smart contract and governance risks remain, but security track record has been robust at base layer.
Earnings & Margins (Score: 64 / 100)
Protocol revenues (fees) scale with on-chain activity; margins are structurally high because costs are largely fixed (security and infrastructure).
Activity is cyclical, compressing during crypto winters but rebounding strongly in bull phases.
Growth Outlook (Score: 76 / 100)
Structural growth drivers: L2 scaling, tokenization of real-world assets, DeFi maturation, and on-chain infrastructure for traditional finance.
Headwinds: Regulatory overhang in some jurisdictions, competition from alternative L1s/L2s, UX complexity.
Valuation Snapshot (Score: 60 / 100)
No conventional cash-flow multiple applies; valuation is cycle- and liquidity-driven.
Relative to prior cycle extremes, current levels represent a mid-cycle correction rather than deep value; risk/reward improves materially in lower buy zones.
Fundamental Composite Score: 68 / 100
5. Intrinsic Value & Fair Value
ETH has no intrinsic value in a classical discounted cash flow sense; instead, its “fair value” is a function of network usage, fee flows, and speculative demand for future adoption.
Current price (~2,012.60) sits modestly above long-term trend support, implying no margin of safety for large fresh allocations but an acceptable entry for incremental DCA.
A durable margin of safety emerges progressively in the 1,600–1,300 band, and deep value only begins to appear closer to the 700 handle if the long-term thesis remains intact.
Core risk: A failure of on-chain activity growth, regulatory shocks, or a meaningful loss of developer/liquidity share to competing platforms.
6. Technical Analysis
Trend status:
Long-term secular uptrend still technically intact via rising multi-year trendline.
Medium-term trend (from 4,955.90 high) is down, with a sequence of lower highs and lows.
Regime:
Correction / trendline retest, transitioning between distribution and potential re-accumulation.
Momentum:
Bearish but slowing as price approaches structural support; candles show extended downside moves but with emerging reaction off the trendline.
Bias change triggers:
Bullish bias reinforcement: Monthly close above ~2,800 with improving candle structure and diminishing downside wicks.
Bearish regime confirmation: Monthly close below ~1,286 followed by failure to reclaim that level.
7. Key Price Levels / Scenario Engine
Tag | Level / Price (USD) | Action / Role | Scenario Allocation Notes (Worst / Base / Best) |
Resistance / Prior Cycle High | 4,955.90 | Major supply; late-cycle distribution zone | Exit/trimming reference only |
2,012.60 | Primary support | First structural demand cluster / BZ1 | 100% / 50% / 33% |
1,605.63 | Secondary support | Deeper value band / BZ2 | 0% / 50% / 33% |
1,286.25 | Major support | High-conviction re-accumulation / BZ3 | 0% / 0% / 34% |
700.72 | Stress zone | Cycle-reset/add only if thesis intact | Tail-risk add; outside core scenario engine |
Manhattan Crypto Capital Price Target (T1) | 6,262.39 | Primary take-profit / cycle exit target | Exit for all scenarios |
Allocations are expressed as a percentage of the $1,000 notional deployed in each scenario.
8. BUY SCENARIO — Structured Accumulation (NO FOMO)
$2,012.60:
Technical: First major horizontal support aligned with rising trendline; prior consolidation and breakout region.
Behavioral: Entry where fear is elevated but not yet panic; buyers attempting to defend the long-term uptrend.
Acquisition Quality Rating: 72 / 100
$1,605.63:
Technical: Mid-range demand pocket from the prior base; aligns with a key Fibonacci retracement of the full bull leg and historical reaction lows.
Behavioral: Higher capitulation potential as late bulls are forced out; better asymmetry if long-term thesis holds.
Acquisition Quality Rating: 82 / 100
$1,286.25:
Technical: Major structural support corresponding to the base of prior multi-month consolidation and deep Fib retrace.
Behavioral: Represents real fear; only conviction capital is buying.
Acquisition Quality Rating: 90 / 100
$700.72 (tail add):
Technical: Deep cycle-reset zone anchored near the previous secular base and high-timeframe demand.
Behavioral: Extreme fear; only long-horizon capital should add here if the protocol’s fundamentals remain intact.
Acquisition Quality Rating: 95 / 100 (tail-risk, conditional)
Example DCA plan with $1,000 notional (Best-case playbook):
2,012.60 → $330
1,605.63 → $330
1,286.25 → $340
700.72 → optional tail-add using recycled profits, not initial $1,000.
9. SELL / RISK-OFF SCENARIO (NO SHORTS UNLESS STRUCTURAL BREAK)
Primary take-profit:
Manhattan Crypto Capital Price Target T1 at 6,262.39. All three core scenarios exit at or near this level.
Trim zones:
Initial trims can occur near the prior all-time high band around 4,955.90 if momentum stalls or blow-off characteristics emerge.
Full de-risk triggers:
Confirmed rejection from the 6,262.39 region with weakening momentum.
Macro shift to severe risk-off (credit stress, liquidity withdrawal) even if target not fully hit.
Invalidation / structural break:
Monthly close below 700.72 that fails to reclaim that level, especially if accompanied by on-chain activity deterioration or serious protocol/regulatory shocks.
Capital rotation:
Profits exit into Manhattan Crypto Capital’s private credit engine, BTC reserve positions, high-quality equities, and/or gold depending on macro conditions.
10. Risk Profile
Volatility classification: Extreme. ETH routinely experiences 50–80% drawdowns within cycles.
Historical / projected drawdown risk:
From current levels, a retrace to 1,286.25 implies ~36–40% downside; to 700.72 implies ~65% downside. Both are plausible within a crypto bear phase.
Trend strength:
Long-term trend: Moderate but at risk if 1,286.25 fails.
Medium-term trend: Weak / bearish since the last peak.
Probability-weighted success range:
55–65% probability that at least one buy zone leads to a profitable move toward or into the 4,955.90–6,262.39 band over the next full crypto cycle, assuming no catastrophic protocol failure.
Total Risk Score: 38 / 100 (1 = extreme risk, 100 = minimal).
Tail-risk scenarios:
Severe regulatory action on staking or DeFi.
Major smart-contract or protocol-level exploit.
Prolonged macro tightening and risk-asset liquidation.
11. Fundamental / Structural Health Check
Ethereum remains the dominant smart contract platform with entrenched network effects in liquidity, applications, and infrastructure.
Execution risk exists around scaling (L2 ecosystem, data availability, restaking), but the roadmap is credible and supported by a strong developer base.
Competitive pressure from alternative L1s and L2 ecosystems is real; however, liquidity and brand depth still favor Ethereum.
No evidence of structural collapse; risk is cyclical and regulatory rather than existential at this stage.
11A. Financial Profile & Cash Flow Characteristics (Crypto-Adapted)
Cash flows to ETH holders are indirect via staking rewards and potential deflation of supply.
Base layer fee revenue plus burn dynamics can make ETH structurally deflationary in high-usage regimes.
Staking yields provide a bond-like income stream but are subject to slashing and protocol/regulatory risk.
In the Manhattan Crypto Capital stack, ETH is a synthetic growth equity with embedded optionality, not a primary yield instrument.
12. Quantitative Scoring Framework
Component | Score (0–100) |
Business Quality | 72 |
Financial Strength | 68 |
Earnings & Margins | 64 |
Growth Outlook | 76 |
Valuation Discipline | 60 |
Fundamental Composite | 68 |
Technical Structure | 48 |
Total Quant Score | 52 |
13. Risk-On / Risk-Off Composite
Risk-On Score: 56
Risk-Off Score: 44
Interpretation: The asset is still in correction, but high-timeframe support and multi-zone demand improve asymmetry. Manhattan Crypto Capital can justify measured, rules-based accumulation, not aggressive all-in deployment.
14. Strategic Interpretation (Manhattan Crypto Capital Risk Mandate)
If price holds above 2,012.60 on a monthly basis: Gradual accumulation via small tranches is acceptable, with room reserved for lower zones.
If price breaks 2,012.60 and trades into 1,605.63–1,286.25: Increase DCA intensity as long as on-chain and macro signals remain constructive.
If price flushes toward 700.72: Treat as a cycle-reset opportunity for long-horizon capital, funded by prior profits and not by new leverage.
If price closes below 700.72 and fails to reclaim: ETH moves into structural review; new capital pauses and exposure is reduced toward core BTC and yield engines until a new base forms.
Time horizon: Full crypto cycle (multi-year), accepting deep interim drawdowns in exchange for asymmetric upside to the 6,262.39 target zone.
15. Investment Entry, Exit & ROI Scenarios (TABLE)
All scenarios use $1,000 notional and exit at the Manhattan Crypto Capital Price Target (T1) of 6,262.39.
Scenario | Buy Zones Hit (Price Levels) | Approx. Avg Entry (USD) | Exit Level (USD) | Probability (Subjective) | $1,000 Notional ROI (Profit $) | ROI (%) | Notes | ||
Worst | 2,012.60 only | 2,012.60 | 6,262.39 | 30% | ≈ 2,111.6 | ≈ 211% | Shallow correction; only first support tagged before new leg higher. | ||
Base | 2,012.60 and 1,605.63 (equal split) | ≈ 1,809.12 | 6,262.39 | 45% | ≈ 2,461.6 | ≈ 246% | Classic two-stage DCA into trendline and mid-range support. | ||
Best | 2,012.60, 1,605.63, 1,286.25 (equal split) | ≈ 1,634.83 | 6,262.39 | 25% | ≈ 2,830.6 | ≈ 283% | Deep flush into all three zones before cycle re-acceleration. |
15A. Scenario Outcome Interpretation
Scenario | IF (Validation Condition) | THEN (Action) | OR (Invalidation / Risk Response) |
Worst | IF price wicks into ~2,012.60 and closes the month back above that level | THEN treat as reflexive trendline defense; maintain full position toward T1 | OR cut back exposure if follow-through selling breaks 2,012.60 on a subsequent monthly close |
Base | IF 2,012.60 and 1,605.63 both trade and monthly closes hold above 1,605.63 | THEN apply base-case scenario; hold DCA position for move toward 4,955.90–6,262.39 | OR reduce by 25–50% if price repeatedly rejects near 2,800–3,200 and revisits 1,605.63 with weakening structure |
Best | IF 2,012.60, 1,605.63, and 1,286.25 all fill and ETH holds above 1,286.25 on monthly closes | THEN full asymmetric setup is live; hold patiently for cycle expansion to T1 | OR invalidate best-case path and de-risk if a monthly close prints below 1,286.25 or macro turns sharply risk-off |
16. Investment Synthesis
Ethereum remains a high-conviction crypto growth asset with strong network fundamentals but extreme cyclical volatility. The current monthly structure places ETH in a correction regime, retesting its long-term trendline with clearly defined support tiers down to ~1,286 and a final stress zone near 700. For disciplined, cycle-aware capital, the DCA ladder across 2,012.60 → 1,605.63 → 1,286.25 offers attractive asymmetry toward the 6,262.39 Manhattan Crypto Capital Price Target, provided the protocol’s structural health remains intact. This profile is suitable only for investors who can tolerate severe drawdowns and multi-year horizons; conservative or income-focused capital should remain anchored in private credit and core reserves.
17. One-Liner (Institutional Summary)
Ethereum is in a high-timeframe correction back into long-term trend support, offering asymmetric, cycle-driven upside toward 6,262.39 for disciplined, long-horizon capital willing to DCA into fear across the 2,012.60–1,286.25 demand band.
⚠️ LEGAL DISCLAIMER
This content is quantitative research and technical analysis for educational purposes only and does not constitute financial advice, investment recommendations, or solicitation to trade. Investing in securities involves risk, including potential loss of capital. Past performance does not guarantee future results. Always conduct your own research and consult a licensed financial professional before making investment decisions.
Comments