MCC Quant Research Super Micro Computer, Inc. (NASDAQ: SMCI)
- Jan 11
- 3 min read
Asset Type: Equity
Sector: Technology Hardware
Industry: AI/Compute Infrastructure Systems
Timeframe: Weekly (Primary), Multi-Year Chart Context
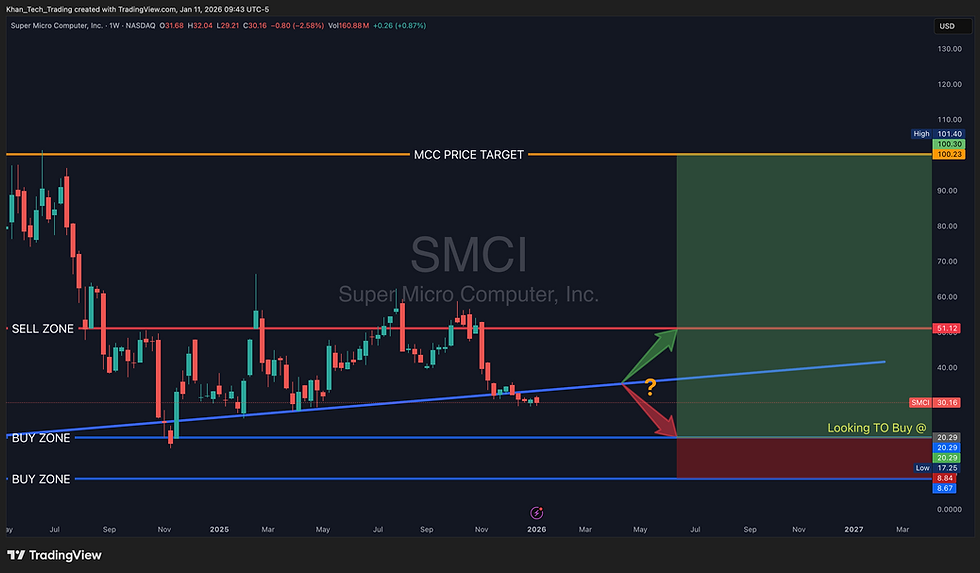
Current Price: $30.16 (as shown in chart)
1. Asset Overview
Super Micro Computer, Inc. (“SMCI”) is a technology hardware company specializing in high-performance server platforms, particularly for AI, data center, and hyperscale compute environments. The chart shows a weekly timeframe where price has corrected significantly from prior momentum highs.
Asset role within MCC portfolio framework: Tactical growth equity with cyclical exposure to AI infrastructure spending.
2. Fundamental Analysis (Actual Reported Data)
Data sourced from publicly available financial data (e.g., stockanalysis.com) and corroborated with official filings.
Business Quality
Strong niche positioning in AI and high-performance computing systems.
Competitive suite of customizable solutions for hyperscalers and enterprises.
Customer concentration and cyclicality are structural risks.
Business Quality Score: 78
Financial Strength
Market Capitalization: $18.00B
Enterprise Value: $18.96B
Cash & Equivalents: $4.21B
Total Debt: $5.17B
Net Debt: ~$0.95B (net leverage)
Current Ratio: 5.39
Debt/Equity: 0.79
Interest Coverage: 13.79
Financial Strength Score: 72
Profitability & Efficiency
TTM Revenue: $21.05B
Gross Profit: $2.12B
Operating Income: $926.05M
Net Income: $792.81M
EPS (TTM): 1.26
Margins have been pressured recently due to pricing competition and supply normalization.
Earnings & Margins Score: 61
Growth Outlook
Secular demand for AI compute capacity remains intact.
Near-term hyperscaler capex moderation introduces cyclical risk.
Enterprise demand uncertain.
Growth Outlook Score: 70
Valuation Snapshot
Trailing P/E: 23.99
Forward P/E: 13.03
P/S: 0.85
Forward P/S: 0.43
Price/Book: 2.76
PEG: 0.45
Valuation reflects a significant reset from prior peaks but is still priced for normalized earnings recovery.
Valuation Score: 64
3. Intrinsic Value & Fair Value
Intrinsic Value Estimate: $45–$55 (normalized earnings and forward multiples)
Current Price: $30.16
Margin of Safety: Present but not deep; strongest near $20–$21 buy zone
Margin of safety increases materially if price revisits structural demand below current levels.
4. Technical Analysis
Based on the provided weekly chart:
Price has corrected from the prior cycle highs above $100.
Multiple rejections from $51.12 resistance.
Current structure shows compression around a rising trendline tested multiple times.
No confirmed higher highs or breakout signals present.
Trend Regime: Distribution → Compression
Volatility: Elevated to moderate
5. Key Price Levels
Resistance Zones
$51.12 — Prior distribution and structural rejection
$100.23–$101.40 — Historical momentum highs (MCC price target region)
Support / Buy Zones
$20.29 — Primary demand zone (structural support)
$17.25–$8.84 — Secondary deep value zone
6. Quantitative Scoring Framework
Category | Score (1–100) |
Business Quality | 78 |
Financial Strength | 72 |
Earnings & Margins | 61 |
Growth Outlook | 70 |
Valuation | 64 |
Fundamental Composite | 69 |
Technical Structure | 45 |
Total Quant Score | 65 |
7. Risk-On / Risk-Off Composite
Risk-On Score: 42
Risk-Off Score: 58
Interpretation: Risk-off bias remains dominant due to incomplete technical confirmation and cyclical uncertainty. Deployment requires either structural confirmation or clear value support absorption.
8. Investment Entry, Exit & ROI Scenarios
Entry & Exit Framework
Primary Entry Zone: $20.29 — structural demand
Secondary Entry Zone: $17.25–$8.84 — deep value
Invalidation / Stop Level: $17.25
Base Exit / Target: $51.12 — prior structural resistance
Bull Case Target: $100.23–$101.40 — cycle reversion zone
ROI Scenario Modeling
Best Case Scenario
Entry: $20.29
Exit Target: $100.23
Estimated ROI: +395%
Probability Weight: Low–Moderate (requires earnings recovery + breakout)
Base Case Scenario
Entry: $20.29
Exit Target: $51.12
Estimated ROI: +152%
Probability Weight: Highest (structural mean reversion within range)
Worst Case Scenario
Entry: $20.29
Invalidation: $17.25
Estimated ROI: ~ −15%
Probability Weight: Moderate (cyclical demand contraction)
9. Strategic Interpretation (MCC Risk Mandate)
If price holds above $20.29 and shows evidence of demand absorption, then phased accumulation is appropriate.
If price breaks and closes below $17.25, then capital preservation takes priority and exposure is reduced.
If price breaks above $51.12 with improving fundamentals, then re-rating toward the next structural resistance is warranted.
10. Investment Synthesis
Super Micro Computer’s secular positioning in AI compute infrastructure is intact, but near-term deployment should be driven by structural validation and valuation discipline rather than momentum extrapolation; the highest probability opportunities are located where price intersects defined demand zones and aligns with earnings stability, allowing capital to be deployed with asymmetric risk-reward characteristics.
11. Message from the CEO and Fund Manager
Zaid Khan, CEO and Fund Manager of Manhattan Crypto Capital, emphasizes that sustainable long-term returns are generated through disciplined valuation assessment, structural confirmation, and respect for capital preservation. MCC’s research process prioritizes confirmed demand absorption, defined risk limits, and alignment between fundamentals and price structure before risking incremental capital, especially in cyclically sensitive technology exposures such as SMCI.
⚠️ LEGAL DISCLAIMER (MANDATORY)This content is quantitative research and technical analysis for educational purposes only and does not constitute financial advice, investment recommendations, or solicitation to trade. Investing in securities involves risk, including potential loss of capital. Past performance does not guarantee future results. Always conduct your own research and consult a licensed financial professional before making investment decisions.


Comments