Bitcoin / U.S. Dollar (BTCUSD)
- Mar 16
- 7 min read
Manhattan Crypto Capital Quant Research
Asset Type: Crypto – Base Layer / Digital Asset
Sector: Digital Assets
Industry: Cryptocurrency / Store of Value
Chart Timeframe: 1W
Current Price (Chart): ≈ $73,887
Vehicle Role: Core Crypto Beta / Cycle Engine
Fund Mandate: Crypto Engine – High-Volatility, High-Asymmetry Growth
Issue: March 16, 2026
1. Asset Overview
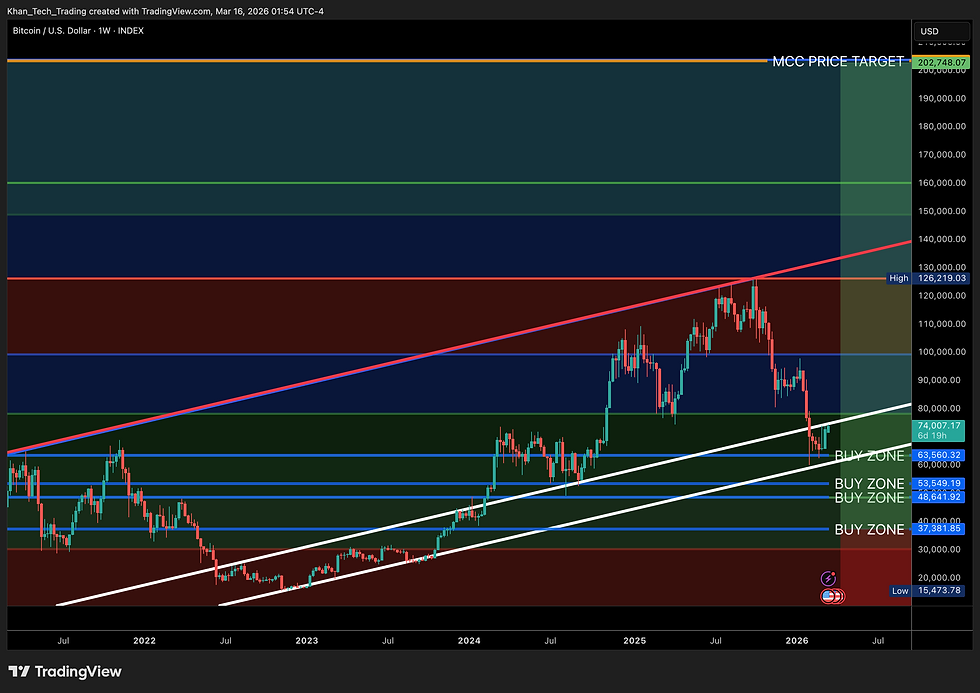
Bitcoin on the weekly INDEX chart exhibits a powerful multi-year uptrend from the $15,474 low, marked by successive higher highs into the $126,219 region before a sharp vertical correction down to the current $73,887 area.
The structure is classic post-parabolic pullback inside an ongoing higher-timeframe bull cycle, with a long-term ascending trendline still intact and multiple stacked Fibonacci-style demand zones below.
The immediate regime is mid-cycle correction after expansion, but the larger trend context remains strongly constructive as long as the $37k–$73k buy complex holds.
Within Manhattan Crypto Capital, BTCUSD functions as the core cycle asset in the Crypto Engine – the primary source of convex upside during expansionary regimes, but also the main contributor to mark-to-market drawdowns if mis-timed or oversized.
2. Market Regime & Quant Score
Market Regime: Mid-Cycle Correction / Pullback inside Uptrend
Total Quant Regime Score: 62 / 100
Trend & Structure (30%) – 22/30
Higher-timeframe uptrend intact; current 1W structure shows clean higher lows and adherence to the long-term ascending channel.
Momentum (RSI/derivatives) (20%) – 10/20
Weekly momentum cooling after the recent high; short-term flattening consistent with healthy digestion.
Volatility Regime (ATR/range) (15%) – 9/15
Volatility contracted post-rally; room for renewed expansion on continuation.
Volume/Participation (15%) – 8/15
Healthy participation on the prior advance; no clear distribution visible on a higher timeframe.
Key Level Integrity (10%) – 7/10
Stacked buy zones below vs. open upside; asymmetry improves materially on any test of the $63k–$37k cluster.
Macro/Sector Overlay (10%) – 6/10
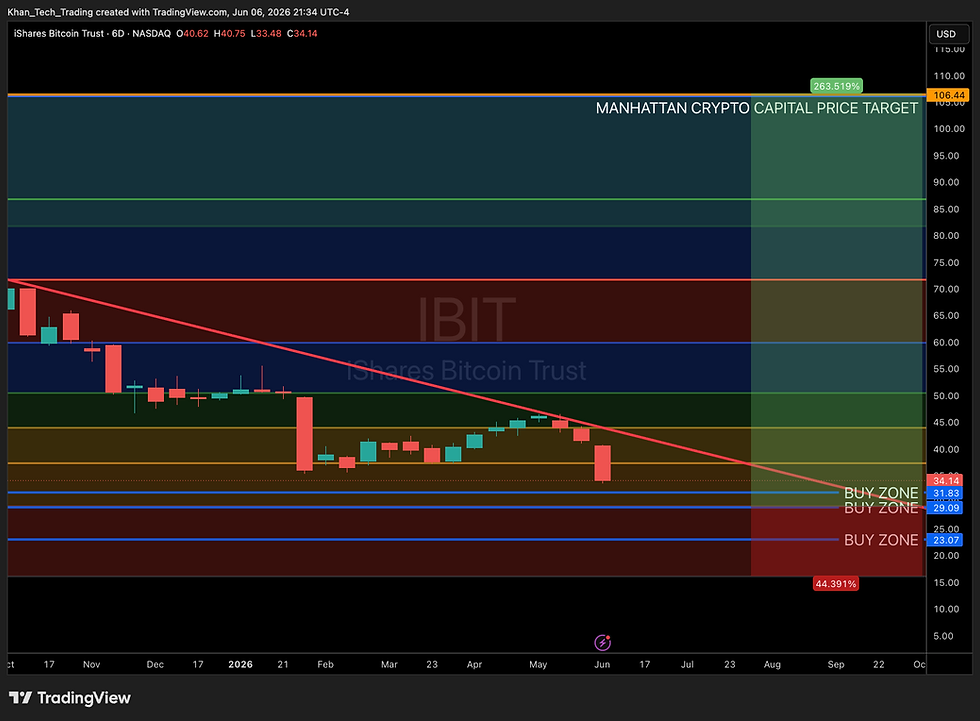
BTC remains structurally supported by institutional adoption, ETF inflows, and macro debasement narratives, cycle risk is still non-trivial.
RSI Offset: Neutral regime (no extreme reading visible).
Fear / Greed Quant State: Moderate Fear Risk-On Score: 58/100 Risk-Off Score: 42/100 (Risk-On dominates)
Institutional Interpretation: Bull structure intact, highest-probability path favors accumulation into defined buy zones rather than chasing near recent highs. Confirmation above $126,219 shifts bias aggressively bullish.
3. MCC Portfolio Context
Role Inside Manhattan Crypto Capital Engines Primary: Core Crypto Engine asset and cycle driver. Secondary: Collateral/reference asset for crypto beta hedging via private credit, gold, and equities.
Volatility Behavior Capable of 20–30% drawdowns in weeks and 50%+ drawdowns within a cycle. Funding, leverage, and derivatives positioning can accelerate both selloffs and recoveries.
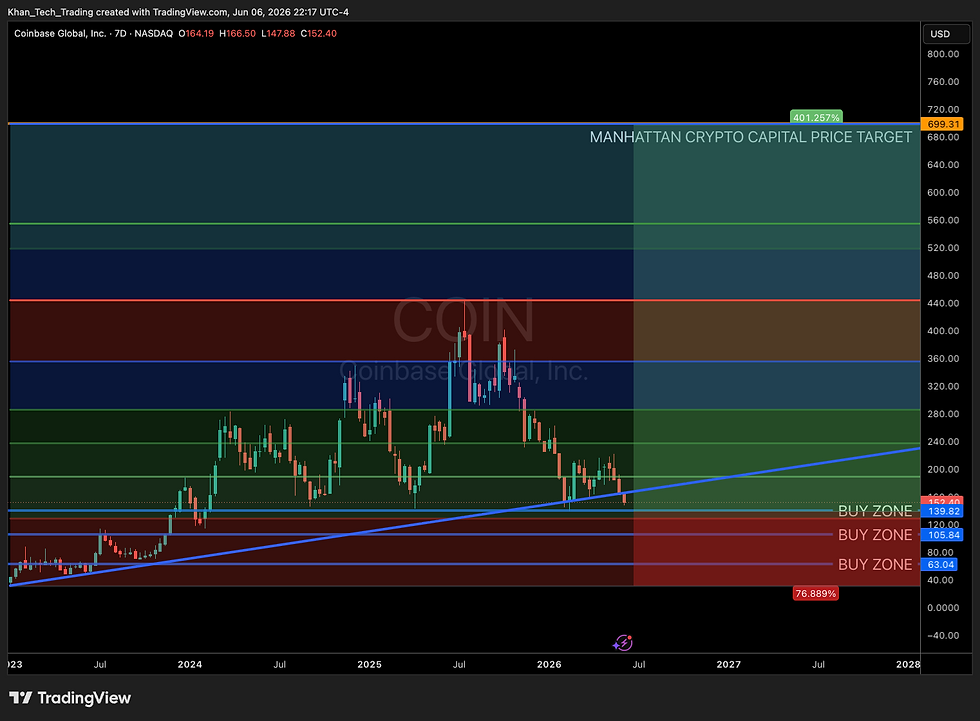
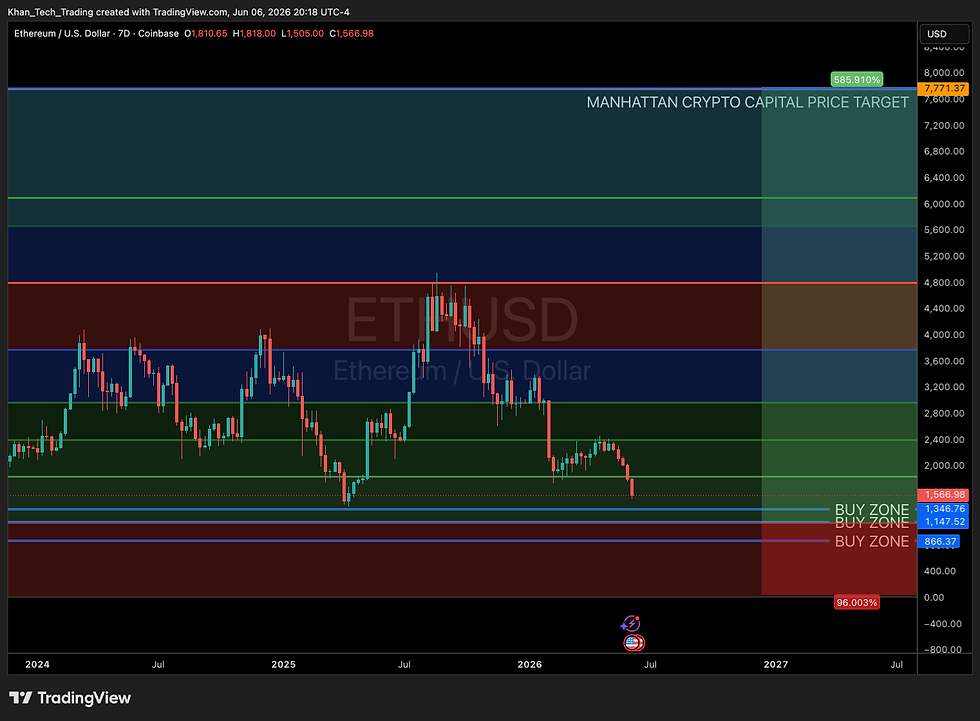
Interactions & Correlations Positively correlated with high-beta tech and crypto proxies (MSTR, COIN, ETH). Often negatively correlated with USD strength and real yields over multi-month horizons.
Capital Rotation Logic:
Rotate into BTC when price trades into predefined buy bands under fear/liquidation.
Rotate out of BTC into private credit, gold, or equities after large multiple expansions toward cycle targets (here $202,748) or structural breakdowns below $37k.
4. Fundamental / Structural Health Check
Business Quality 90/100 (most established proof-of-work chain, strong security budget)
Earnings & Growth Outlook 82/100 (institutional adoption and ETF flows)
Valuation Discipline 60/100 (cycle-rich but justified on extension)
Macro Resilience 65/100
Fundamental Composite Score: 74 / 100 Intrinsic/fair-value band approximated $50k–$100k on network effects and liquidity.
At ≈ $73,887, BTC trades in the middle of the band – not distressed but with limited margin of safety until deeper buy zones are tested.
“What must go right” includes continued ETF inflows and macro debasement; the margin of safety expands significantly below $63k.
5. Technical Analysis
Trend state: Higher-timeframe uptrend from $15,474 low with successive higher highs into $126,219. The current 1W structure shows a healthy pullback within the long-term channel while respecting the ascending trendline.
Key Observations: Recent advances tested the upper supply zone near $126k before sharp supply absorption. Multiple labeled demand zones ($73,887 / $63,560 / $53,549 / $48,642 / $37,382) create stacked support. No reversal patterns visible; continuation favored as long as higher lows hold.
Bias Change Triggers:
Bullish: Weekly close above $126,219 with volume confirmation opens path to MCC target $202,748.
Bearish: Sustained weekly close below $63,560, followed by a loss of $37,382, would signal a deeper correction toward $15k or below.
6. Key Price Levels (From Chart)
Tag / Level Type | Price | Action / Role | Notes |
MCC Cycle Target (T1) | $202,748 | Primary exit objective | Cycle-extension target |
Resistance / Supply Block R1 | $126,219 | Recent high / pivot | Reclaim shifts bias bullish |
Buy Level 1 (BZ1) | $73,887 | Initial buy zone / DCA 1 | First major demand band (current) |
Buy Level 2 (BZ2) | $63,560 | Secondary buy zone / DCA 2 | Stronger support |
Buy Level 3 (BZ3) | $53,549 / $48,642 | Tertiary buy zone / DCA 3 | Deeper retracement cluster |
Deep DCA / Extreme Buy Band (BZ4) | $37,382 | Optional extreme fear | Major long-term demand zone |
7. BUY SCENARIO — Structured Accumulation (NO FOMO)
MCC does not add BTC inside noisy mid-range chop without a level-based plan. Accumulation is only triggered on tests of the buy bands. The standard DCA plan uses three primary levels (BZ1–BZ3); BZ4 is an optional extreme-fear add-on.
Illustrative $1,000 Notional DCA Plan (Standard)
BZ1 – $73,887: $300 (30%)
BZ2 – $63,560: $350 (35%)
BZ3 – $53,549: $350 (35%)
BZ1 – $73,887
Role: First re-entry band after minor pullback, attracts initial dip-buyers.
Behavioral Lens: Early digestion flows.
Acquisition Quality Rating: 68 / 100
BZ2 – $63,560
Role: Deeper flush toward mid-range support.
Behavioral Lens: Increased fear, better asymmetry.
Acquisition Quality Rating: 78 / 100
BZ3 – $53,549
Role: Strong discount vs. $126k high.
Behavioral Lens: Panic/liquidation pockets, structurally attractive.
Acquisition Quality Rating: 86 / 100
Optional BZ4 – $37,382
Role: Extreme-fear band if macro shock deepens.
Use: Opportunistic add only if the cycle thesis remains intact.
8. SELL / RISK-OFF SCENARIO
Trim & Exit Logic (Tactical): $126,219 zone: Consider trimming 15–25% on reclaim without volume confirmation. $202,748 (MCC T1): Primary exit/rotation zone.
Full De-Risk / Rotation Conditions (Downside): Sustained acceptance below $63,560 after failed bounces. Loss of $37,382 with strong momentum. In such cases, MCC rotates capital into yield engines, gold, or cash until a new base forms.
9. ROI BY ENTRY LEVEL (MANDATORY TABLE)
Entry Level | Target price | Dollar gain | Percentage ROI |
$73,887 | $202,748 | ≈ $128,861 | ≈ 174% |
$63,560 | $202,748 | ≈ $139,188 | ≈ 219% |
$53,549 | $202,748 | ≈ $149,199 | ≈ 279% |
$37,382 | $202,748 | ≈ $165,366 | ≈ 442% |
(Values approximated using: Dollar Gain = $1,000 × ($202,748 ÷ Entry − 1).)
10. Risk Profile
Volatility Classification: Very High. Weekly swings of 5–10% common, and 30–50% drawdowns are plausible within a cycle leg.
Historical/projected drawdown risk: 40–60% in single-leg corrections.
Trend strength/fragility: Strong above $37,382; fragile below $63,560.
Probability-weighted success range: 55–70% on DCA into buy zones.
Tail-risk scenarios: (1) Prolonged macro tightening, (2) Regulatory shock.
Total Risk Score: 35 / 100
Position-sizing discipline: 1–3% AUM; ATR/stop checks applied.
11. Quantitative Scoring Framework
Component | Score (/100) | Notes |
Trend / Structure | 73 | Weekly uptrend intact. |
Momentum / Oscillators | 50 | Cooling after high. |
Volatility / Expansion Potential | 60 | Room for continuation. |
Volume / Flow | 53 | Healthy prior participation. |
Support–Resistance Asymmetry | 70 | Clear buy zones below. |
Macro / Fundamental Backdrop | 65 | Adoption narrative supportive. |
Total Quant Score: 62 / 100 |
12. Risk-On / Risk-Off Composite
Dimension | Score (/100) | Interpretation |
Risk-On | 58 | Supports accumulation into buy zones with cycle horizon. |
Risk-Off | 42 | Inappropriate for capital unable to tolerate crypto drawdowns. |
Interpretation: BTC remains a core risk-on-cycle asset, MCC engages only via predefined buy zones and rotates out near the $202,748 target or on structural failure.
13. Investment Entry, Exit & ROI Scenarios (3 Tables)
Assume standard DCA using BZ1–BZ3. All scenarios exist at T1 = $202,748.
Worst-Case Scenario (Only BZ1 Fills)
Avg entry: $73,887 Probability: 35%
$1,000 ROI: ≈ $128,861 (174%)
Notes: Shallow pullback; quick resumption.
Base-Case Scenario (BZ1 & BZ2 Fill)
Avg entry ≈ $68,724
Probability: 45%
$1,000 ROI: ≈ $134,024 (190%)
Notes: Healthy correction, then advance.
Best-Case Scenario (BZ1–BZ3 Fill)
Avg entry ≈ $63,665
Probability: 20%
$1,000 ROI: ≈ $139,083 (219%)
Notes: Deep retrace maximizes asymmetry.
14. Strategic Interpretation (MCC Risk Mandate)
For Manhattan Crypto Capital, BTCUSD is a core but high-risk cycle engine.
Mandate: Only accumulate within the $73,887 / $63,560 / $53,549 buy complex (with $37,382 optional extreme). Avoid adding size near $126k+ without confirmation.
Treat $202,748 as the cycle exit objective with tactical trims at resistances. Respond to breakdowns below $37k by rotating into yield engines, gold, and cash.
15. Investment Synthesis
BTC is structurally sound and cyclically volatile. The weekly chart shows a powerful uptrend with clearly defined buy zones at $73k–$37k and MCC cycle target at $202,748.
Deploying capital into BZ1–BZ3 during pullbacks offers attractive upside leverage (ROI 174%–442% on $1,000 notional).
The risk mandate demands patience for those levels, disciplined DCA, and pre-committed exits on both success and failure. Best suited for long-horizon risk-tolerant investors; single biggest risk factor: prolonged macro tightening.
16. One-Liner (Institutional Summary)
Bitcoin remains Manhattan Crypto Capital’s core crypto cycle engine, to be accumulated only into the $73,887 / $63,560 / $53,549 buy complex (and opportunistically at $37,382), with a disciplined cycle exit framework anchored on the $202,748 MCC target and strict structural guardrails below the deep DCA band.
17. Scenario Outcome Interpretation
Scenario | IF (Validation) | THEN (Action) | OR (Invalidation/Risk Response) |
Worst Case | Only BZ1 ($73,887) tagged and holds above | Maintain position and target $202,748 | If loses $73k with momentum, prepare to add at BZ2/BZ3 or cut risk. |
Base Case | BZ1 and BZ2 filled and reclaims above $73k | Treat as primary campaign and hold for $202,748 target | Reduce exposure on repeated rejections near $126k leading to closes below $63k. |
Best Case | BZ1–BZ3 all fill while higher-timeframe structure intact | Hold full DCA (optionally add BZ4) for maximum asymmetry to $202,748 | Aggressively de-risk on sustained closes below $37k. |
18. Legal Disclaimer (MANDATORY)
This content is quantitative research and technical analysis for educational purposes only and does not constitute financial advice, investment recommendations, or solicitation to trade. Investing in securities involves risk, including potential loss of capital. Past performance does not guarantee future results. Always conduct your own research and consult a licensed financial professional before making investment decisions.

Comments